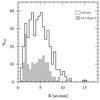
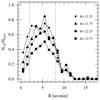
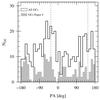
Fig. 4
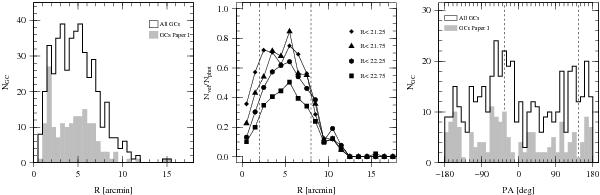
Spatial distribution of the velocity-confirmed GCs. Left panel: radial distribution of the spectroscopic GC sample. The unfilled and grey histograms show the full sample and the data from Paper I, respectively. Middle panel: radial completeness for different faint-end magnitude limits: for the GCs from the D+05 catalogue, we plot the ratio of GCs with velocity measurements with respect to the total number of GC candidates with colours in the range () found for the kinematic sample (cf. Fig. 5, left panel). Right panel: azimuthal distribution of the GCs. The position angle (PA) is measured North over East and the dashed lines indicate the location of the photometric major axis of NGC 4636. The histogram styles are the same as in the left panel.
Current usage metrics show cumulative count of Article Views (full-text article views including HTML views, PDF and ePub downloads, according to the available data) and Abstracts Views on Vision4Press platform.
Data correspond to usage on the plateform after 2015. The current usage metrics is available 48-96 hours after online publication and is updated daily on week days.
Initial download of the metrics may take a while.