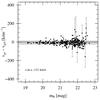
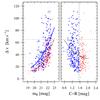
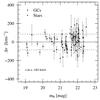
Fig. 2

Velocity uncertainties. Left: comparison of the GC velocity estimates obtained with the two different template spectra. For graphic convenience, the error-bars (the two fxcor-uncertainties added in quadrature) are only shown for objects where the estimates differ by more than 75 km s-1. The grey area shows the region encompassing 68 per cent of the data points. Middle: velocity uncertainties as determined by fxcor. Left sub-panel: fxcor-uncertainty vs. R-magnitude. Crosses and dots represent blue and red GCs, respectively. The solid and dashed curve show a quadratic fit to the blue and red GC data, respectively. Right sub-panel: fxcor-uncertainty vs. colour. The dashed line at indicates the colour dividing blue from red GCs. The solid line illustrating the increase of the uncertainties towards bluer colours is a 2nd order polynomial fit to the data. The dashed lines at Δv = 65 km s-1 show the limit adopted for the sample definition in Sect. 5.2. Right: comparison of the duplicate velocity measurements. Dots and crosses represent GCs and stars, respectively. The dashed lines show the rms scatter of 84 km s-1 found for the GCs.
Current usage metrics show cumulative count of Article Views (full-text article views including HTML views, PDF and ePub downloads, according to the available data) and Abstracts Views on Vision4Press platform.
Data correspond to usage on the plateform after 2015. The current usage metrics is available 48-96 hours after online publication and is updated daily on week days.
Initial download of the metrics may take a while.