Fig. 15
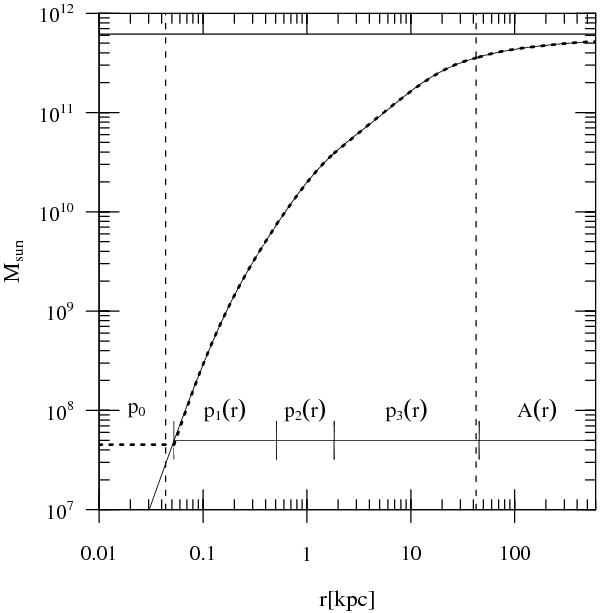
NGC 4636 stellar mass profile. The thin solid curve is Eq. (10) for Υ ⋆ ,R = 5.8 (obtained through numerical integration). The thick dotted curve is the piecewise approximation used in our modelling. The radial range of the respective pieces is indicated by the bars, and the functions and coefficients are given in Appendix B. The vertical dashed lines indicate the radial range of the photometric data by D+05. The horizontal line at 6.15 × 10¹¹ M⊙ shows the asymptotic value, i.e. M(r = ∞).
Current usage metrics show cumulative count of Article Views (full-text article views including HTML views, PDF and ePub downloads, according to the available data) and Abstracts Views on Vision4Press platform.
Data correspond to usage on the plateform after 2015. The current usage metrics is available 48-96 hours after online publication and is updated daily on week days.
Initial download of the metrics may take a while.