Fig. 11
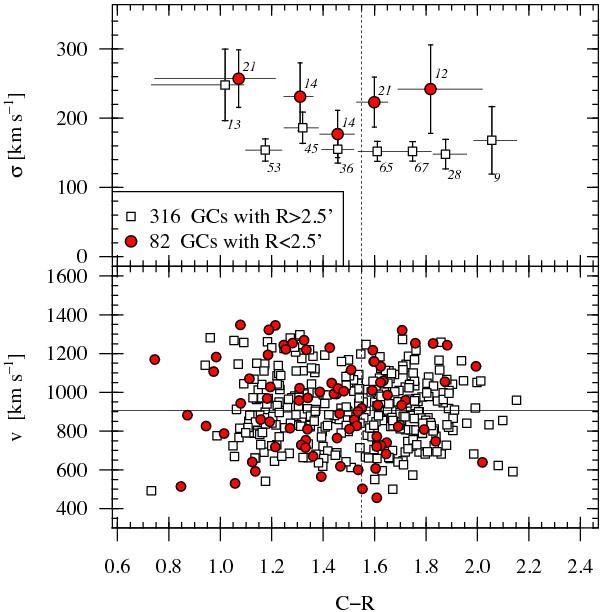
Upper panel: line-of-sight velocity dispersion as a function of colour. Dots represent the values for the 82 GCs within 2 5 and velocity uncertainties below 65 km s-1, squares show the results for the 316 GCs of the AllFinal sample. The labels give the number of GCs per bin. The bin size is 0.15 mag, but the bluest and reddest bins have been resized so that no objects are excluded. The horizontal bars mark the colour range covered by a given bin. Lower panel: heliocentric velocity as a function of colour. The symbols are the same as in the upper panel.
Current usage metrics show cumulative count of Article Views (full-text article views including HTML views, PDF and ePub downloads, according to the available data) and Abstracts Views on Vision4Press platform.
Data correspond to usage on the plateform after 2015. The current usage metrics is available 48-96 hours after online publication and is updated daily on week days.
Initial download of the metrics may take a while.