Fig. 10
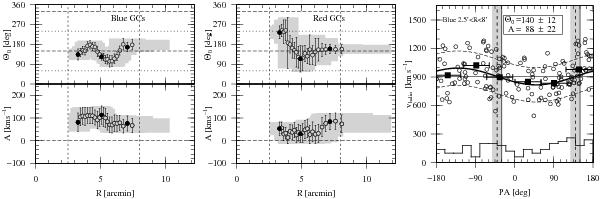
Rotation of the NGC 4636 globular cluster system. Left: circles show the rotation of the final blue sample (BlueFinal) computed for moving bins of 50 GCs with a step site of 5 GCs. The grey area indicates the radial coverage and the uncertainties. Dots indicate independent bins. The upper sub-panel shows the rotation angle Θ0 vs. projected galactocentric radius. The NGC 4636 photometric major and minor axis are shown as long-dashed and dotted horizontal lines, respectively. The lower sub-panel shows the amplitude A as function of radius. Middle: the same as the left panel but for the final red sample (RedFinal). In both plots, the dashed vertical lines indicate the radial range  for which we have the best spatial coverage of the GCS (see also Sect. 4.1). Right: velocity versus position angle for the 141 blue GCs (circles) from the sample BlueFinal with distances between
  and 8′. The thick solid curve shows the best fit of Eq. (3) to the data, the thin dashed curves are offset by the sample dispersion (σ = 180 km s-1). The vertical dashed and solid lines show the best-fit Θ0 and the photometric major axis of NGC 4636, respectively. The grey areas indicate the uncertainty ΔΘ0. The squares show the mean velocity for bins of 60°. The unfilled histogram at the bottom shows the angular distribution of the GCs (the bins have a width of 20° and the counts are multiplied by a factor of 20 for graphic convenience).
Current usage metrics show cumulative count of Article Views (full-text article views including HTML views, PDF and ePub downloads, according to the available data) and Abstracts Views on Vision4Press platform.
Data correspond to usage on the plateform after 2015. The current usage metrics is available 48-96 hours after online publication and is updated daily on week days.
Initial download of the metrics may take a while.