Fig. 6
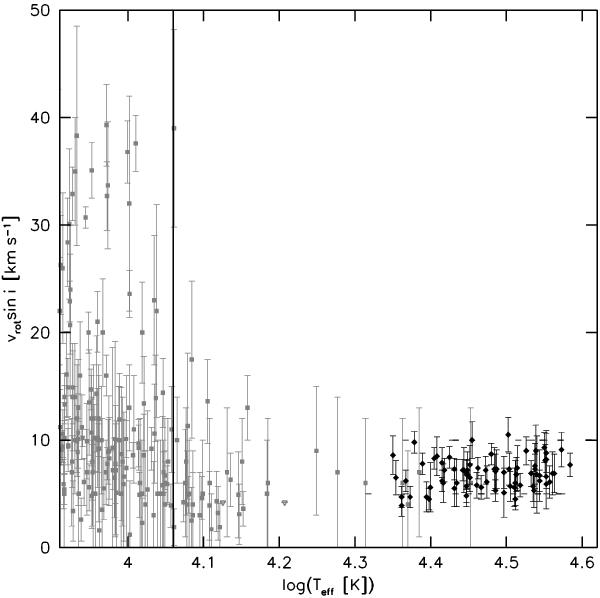
Projected rotational velocity plotted against effective temperature. The grey squares mark BHB and some sdB stars taken from Peterson et al. (1995), Behr (2003a,b), Kinman et al. (2000), and Recio-Blanco et al. (2004). Upper limits are marked with grey triangles. The black diamonds mark the sdBs from our sample. The vertical line marks the jump temperature of 11 500 K.
Current usage metrics show cumulative count of Article Views (full-text article views including HTML views, PDF and ePub downloads, according to the available data) and Abstracts Views on Vision4Press platform.
Data correspond to usage on the plateform after 2015. The current usage metrics is available 48-96 hours after online publication and is updated daily on week days.
Initial download of the metrics may take a while.