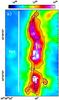
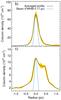
Fig. 3

a) Column density map (in cm-2) of the DR21 ridge with the crest as black dots and the black NH2 = 1023 cm-2 contour. Note that white pixels are undefined because of saturation. Blue ellipses give the position and extent (FWHM = semi-axes) of the Motte et al. (2007) dense cores. b), c) Radial column density profiles towards the crest locations b and c marked in yellow/blue in a). The radial profiles are averaged over the marked crest dots. The yellow areas show the ± 1σ ranges.
Current usage metrics show cumulative count of Article Views (full-text article views including HTML views, PDF and ePub downloads, according to the available data) and Abstracts Views on Vision4Press platform.
Data correspond to usage on the plateform after 2015. The current usage metrics is available 48-96 hours after online publication and is updated daily on week days.
Initial download of the metrics may take a while.