Free Access
Fig. 1
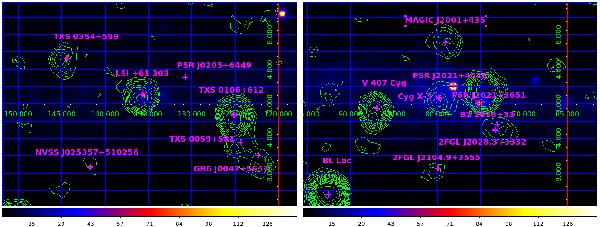
LAT count map and variability contours (σmax values) in the energy band above 300 MeV in the directions of the sky regions containing the LSI +61 303 γ-ray-loud binary (left) and the Cyg X-3 and V407 Cyg γ-ray-loud binaries (right). Contour levels start from 3σ with steps of 0.5σ.
This figure is made of several images, please see below:
Current usage metrics show cumulative count of Article Views (full-text article views including HTML views, PDF and ePub downloads, according to the available data) and Abstracts Views on Vision4Press platform.
Data correspond to usage on the plateform after 2015. The current usage metrics is available 48-96 hours after online publication and is updated daily on week days.
Initial download of the metrics may take a while.