Fig. 9
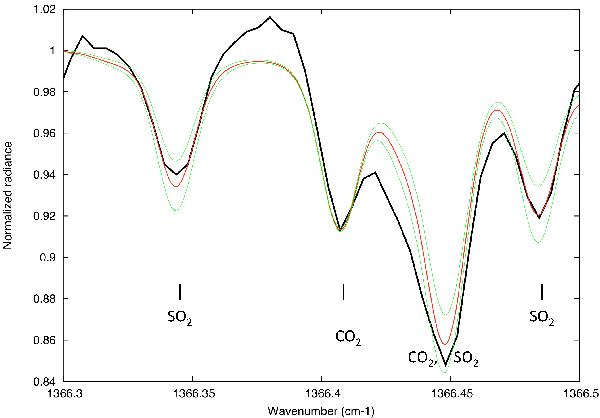
Black thick line: the TEXES spectrum of Jan. 11 in Area 1 (maximum SO2) in the 1366.30–1366.50 cm-1 spectral range, after removal of the continuum slope by a 1st-order polynomial. Thin lines: synthetic models corresponding to different SO2 mixing ratios. Red curve: best fit (SO2 = 125 ppb). Green curves: SO2 = 100 ppb (upper curve) and 150 ppb (lower curve).
Current usage metrics show cumulative count of Article Views (full-text article views including HTML views, PDF and ePub downloads, according to the available data) and Abstracts Views on Vision4Press platform.
Data correspond to usage on the plateform after 2015. The current usage metrics is available 48-96 hours after online publication and is updated daily on week days.
Initial download of the metrics may take a while.