Fig. 6
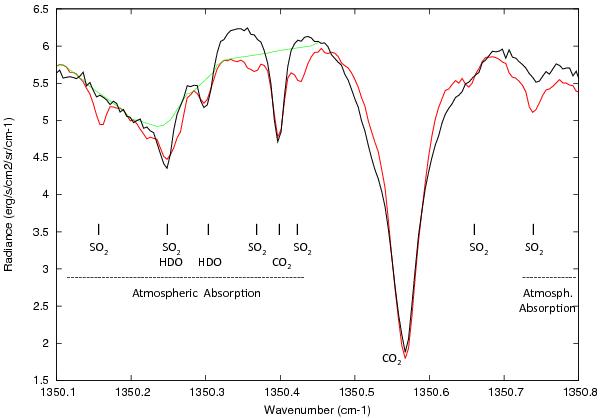
The TEXES spectra on Jan. 10 in (red) Area 1 (maximum SO2) and (black) Area 2 (maximum CO2), in the 1350.10–1350.80 cm-1 spectral range. The telluric absorption is indicated by a green line. The absolute scale of the spectrum in Area 2 has been normalized to the one of Area 1 for comparison. It can be seen that SO2 is not detected in Area 2. At 1350.41 cm-1, the CO2 transition is deeper, mostly due to the higher air mass.
Current usage metrics show cumulative count of Article Views (full-text article views including HTML views, PDF and ePub downloads, according to the available data) and Abstracts Views on Vision4Press platform.
Data correspond to usage on the plateform after 2015. The current usage metrics is available 48-96 hours after online publication and is updated daily on week days.
Initial download of the metrics may take a while.