Fig. 5
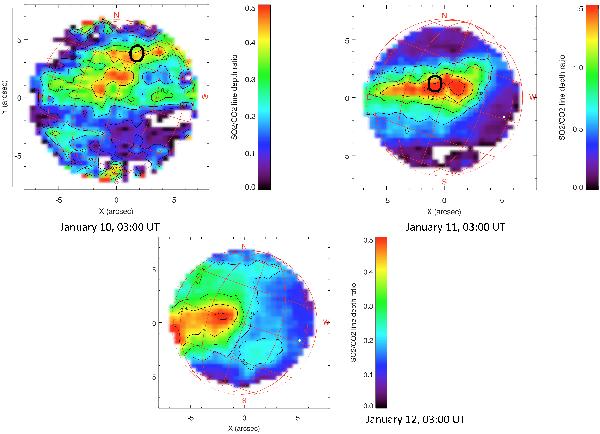
Map of the SO2/CO2 line depth ratio derived from the 1350.16 cm-1 SO2 line and the 1350.40 cm-1 CO2 line (Jan. 10 and 12) and the 1366.48 cm-1 SO2 line and the 1366.41 cm-1 CO2 line (Jan. 11). All frequencies correspond to Doppler-shifted transitions. On Jan. 10 and 11, Area 1 (maximum SO2 line depth) is indicated by a black circle. Area 2 (maximum CO2 line depth) is located around the subsolar point, which is indicated by the white spot. At 1350 cm-1 (Jan. 10 and 12), a depth ratio of 0.45 corresponds to a SO2 mixing ratio of 60 ppm. At 1366 cm-1 (Jan. 11), a depth ratio of 1.5 corresponds to a SO2 mixing ratio of 100 ppm. (see text, Sect. 3.4).
Current usage metrics show cumulative count of Article Views (full-text article views including HTML views, PDF and ePub downloads, according to the available data) and Abstracts Views on Vision4Press platform.
Data correspond to usage on the plateform after 2015. The current usage metrics is available 48-96 hours after online publication and is updated daily on week days.
Initial download of the metrics may take a while.