Fig. 4
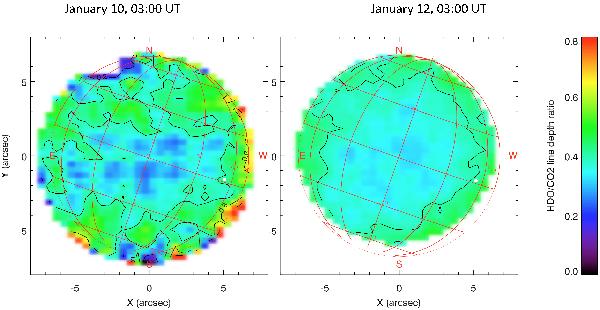
Map of the HDO/CO2 line depth ratio derived from the 1350.30 cm-1 HDO line and the 1350.40 cm-1 CO2 line (Doppler-shifted frequencies). Left: January 10, 2012; right: January 12, 2012. The subsolar point is indicated with the white spot. A depth ratio of 0.4 corresponds to a H2O mixing ratio of 1.5 ppm, assuming a D/H ratio of 200 (see text, Sect. 3.4).
Current usage metrics show cumulative count of Article Views (full-text article views including HTML views, PDF and ePub downloads, according to the available data) and Abstracts Views on Vision4Press platform.
Data correspond to usage on the plateform after 2015. The current usage metrics is available 48-96 hours after online publication and is updated daily on week days.
Initial download of the metrics may take a while.