Fig. 10
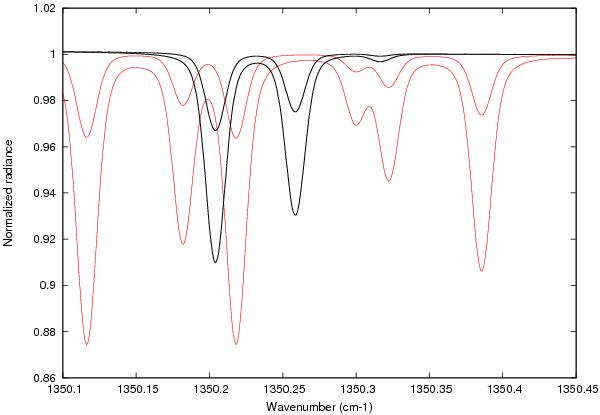
The synthetic spectrum of SO2 and HDO on Venus between 1350.10 and 1350.45 cm-1 (rest frequencies). Red: SO2 = 25 ppb (upper curve) and 100 ppb (lower curve). Black: HDO = 1 ppm (upper curve) and 3 ppm (lower curve). For the SO2 line at 1350.12 cm-1, the line depths are 0.035 and 0.126 respectively; the departure from linearity is 11%. For the HDO line at 1350.26 cm-1, the line depths are 0.025 and 0.070 respectively; the departure from linearity is 7%. Spectra are calculated with a mean airmass of 1.4.
Current usage metrics show cumulative count of Article Views (full-text article views including HTML views, PDF and ePub downloads, according to the available data) and Abstracts Views on Vision4Press platform.
Data correspond to usage on the plateform after 2015. The current usage metrics is available 48-96 hours after online publication and is updated daily on week days.
Initial download of the metrics may take a while.