Fig. 1
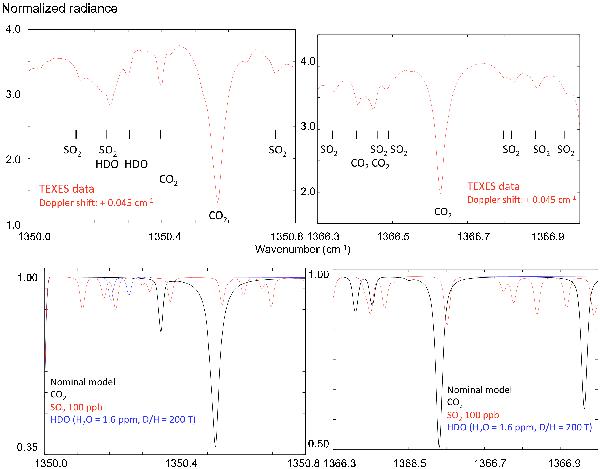
Top: two spectra of Venus recorded by TEXES, integrated over the whole disk, covering the 1350–1350.8 cm-1 range (left) and the 1366.3–1370.0 cm-1 range (right). The weak, broad absorption band at 1350.20–1350.3 cm-1 is due to telluric absorption. Bottom: a model of the Venus mesosphere including transitions of CO2 (black line), HDO (blue line) and SO2 (red line), shifted by + 0.045 cm-1, in the same spectral ranges. Two HDO lines and several SO2 lines are easily identified in the Venus spectra.
Current usage metrics show cumulative count of Article Views (full-text article views including HTML views, PDF and ePub downloads, according to the available data) and Abstracts Views on Vision4Press platform.
Data correspond to usage on the plateform after 2015. The current usage metrics is available 48-96 hours after online publication and is updated daily on week days.
Initial download of the metrics may take a while.