Fig. 2
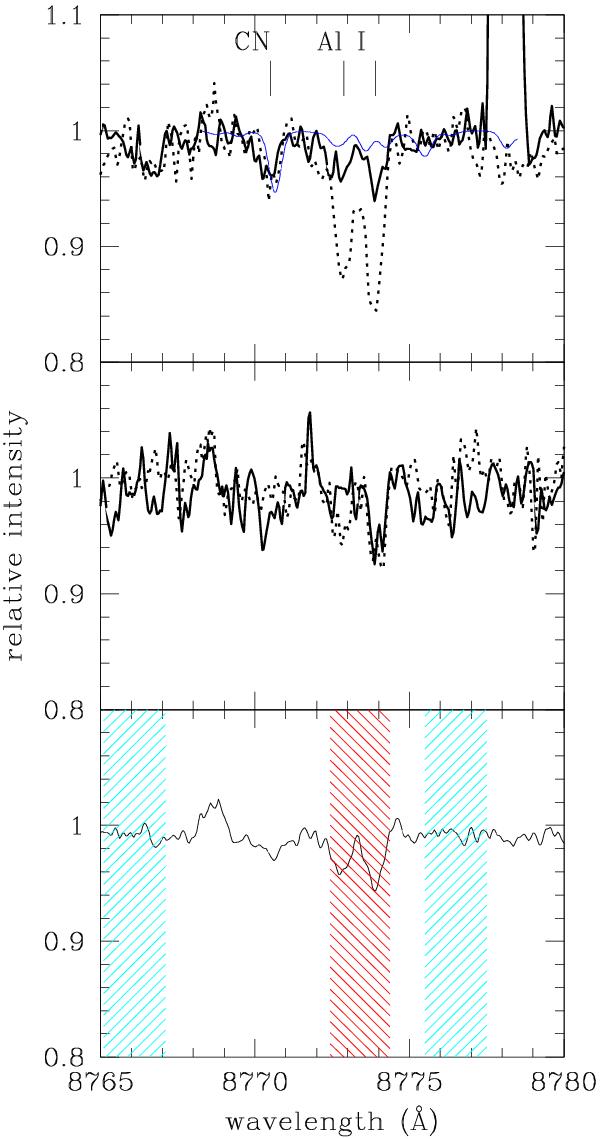
Upper panel: comparison of the observed spectra for star 44939 (solid line, [Al/Fe] = –0.19 dex) and star 35999 (dotted line, [Al/Fe] = +1.06 dex). The thin blue solid line is the synthetic spectrum with no Al ([Al/Fe] = –9.99) computed with the atmospheric parameters relative to star 35999. Middle panel: the same for star 22360 (solid line, [Al/Fe] < −0.09) and star 31520 (dotted line, [Al/Fe] = +0.44). Lower panel: co-added spectrum of the 10 stars with highest S/N. The areas hatched in red and light blue mark the regions used to evaluate the flux appropriate for Al lines as discussed in the text; red is the in-line region, light blue indicates the reference for the continuum.
Current usage metrics show cumulative count of Article Views (full-text article views including HTML views, PDF and ePub downloads, according to the available data) and Abstracts Views on Vision4Press platform.
Data correspond to usage on the plateform after 2015. The current usage metrics is available 48-96 hours after online publication and is updated daily on week days.
Initial download of the metrics may take a while.