Free Access
Fig. 1
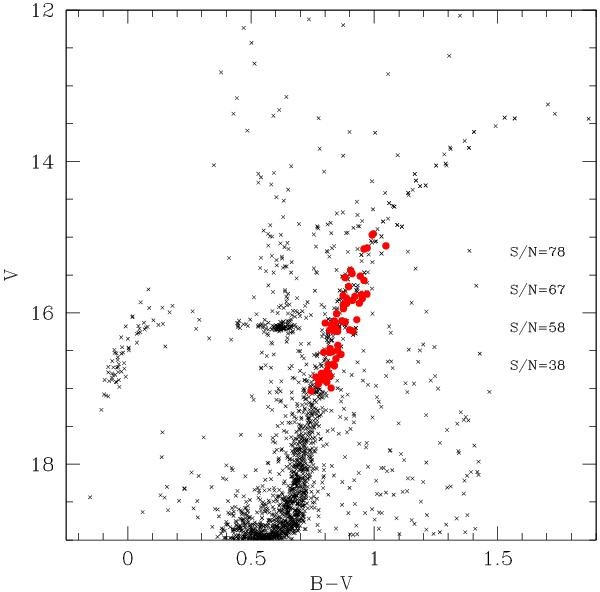
V,B − V colour–magnitude diagram (CMD) of NGC 1851 (grey crosses). Superimposed as large red filled circles are the giants with Al abundances measured in the present study. The average S/N of spectra in bin of half a magnitude is reported to the right of the CMD.
Current usage metrics show cumulative count of Article Views (full-text article views including HTML views, PDF and ePub downloads, according to the available data) and Abstracts Views on Vision4Press platform.
Data correspond to usage on the plateform after 2015. The current usage metrics is available 48-96 hours after online publication and is updated daily on week days.
Initial download of the metrics may take a while.