Fig. 4
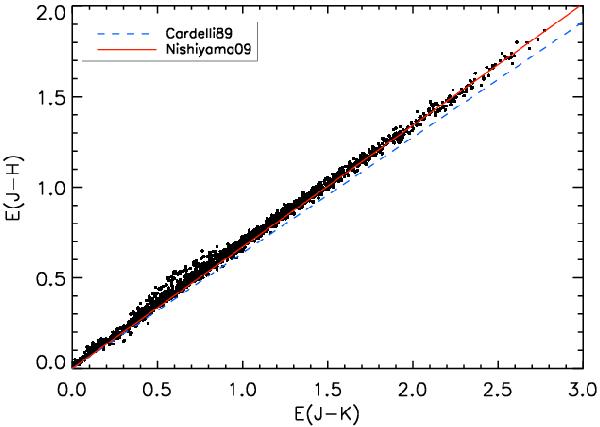
(J − Ks) and (J − H) color difference between our control field and those measured in the subfields of tiles b317, b303, and b275. The size of the subfields corresponds to the same resolution described in Fig. 2. The blue dashed line shows the relation E(J − H) = 0.638E(J − Ks) corresponding to the extinction law from Cardelli et al. (1989) and red solid line to E(J − H) = 0.671E(J − Ks) from Nishiyama et al. (2009).
Current usage metrics show cumulative count of Article Views (full-text article views including HTML views, PDF and ePub downloads, according to the available data) and Abstracts Views on Vision4Press platform.
Data correspond to usage on the plateform after 2015. The current usage metrics is available 48-96 hours after online publication and is updated daily on week days.
Initial download of the metrics may take a while.