Fig. 7
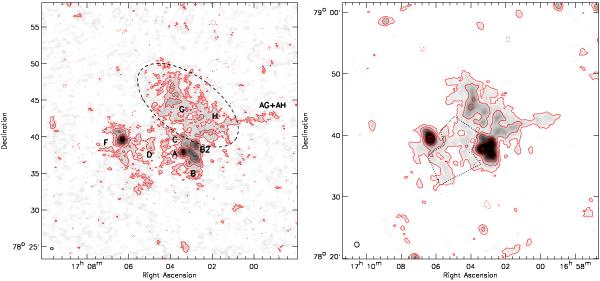
A2256 61–67 MHz images represented in grey scale and contour form. The synthesized beams are shown in the bottom left corner. Left: high-resolution, 22″ × 26″, image made with robust =–0.1 weighting. The radio relic (source G and H) is indicated with the dashed ellipse. Contour levels are drawn at [1,2,4,...] × 30 mJy beam-1. Negative 3σrms contours are shown by the dotted lines. Right: low-resolution image, 52″ × 62″, image made with robust =0.5 weighting. The area for the halo spectral index measurement is indicated by the dotted lines. Contour levels are drawn at [1,2,4,...] × 75 mJy beam-1.
Current usage metrics show cumulative count of Article Views (full-text article views including HTML views, PDF and ePub downloads, according to the available data) and Abstracts Views on Vision4Press platform.
Data correspond to usage on the plateform after 2015. The current usage metrics is available 48-96 hours after online publication and is updated daily on week days.
Initial download of the metrics may take a while.