Fig. 4
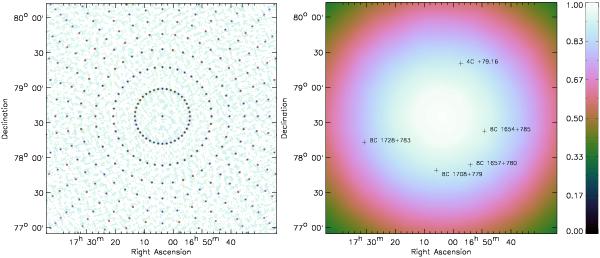
Left: image of the simulated 1 Jy point sources in the A2256 field at 63 MHz. Note that the background is not precisely zero because of deconvolution errors. The apparent flux of the sources decreases radially away from the phase center due to the primary beam attenuation. Color-scale is the same as in the right panel but inverted. Right: primary beam attenuation of the A2256 observations at 63MHz obtained by fitting a surface to the integrated fluxes of the sources in the left panel. The location of sources that were used to obtain the flux-scale are marked with crosses.
Current usage metrics show cumulative count of Article Views (full-text article views including HTML views, PDF and ePub downloads, according to the available data) and Abstracts Views on Vision4Press platform.
Data correspond to usage on the plateform after 2015. The current usage metrics is available 48-96 hours after online publication and is updated daily on week days.
Initial download of the metrics may take a while.