Fig. 10
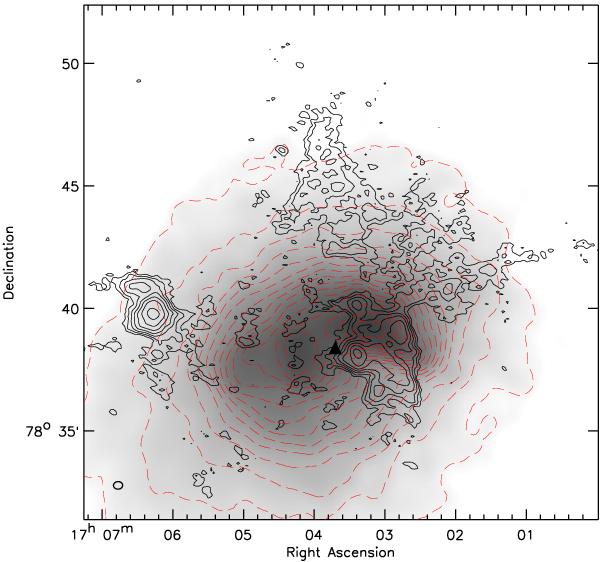
Chandra 0.5–7 keV ACIS-I/S co-added image smoothed by a variable-width Gaussian, Fig. 1 from Sun et al. (2002). Red dashed linearly spaced contours trace the X-ray isophotes. The high-resolution 63 MHz LOFAR image is overlaid with black contours drawn at levels of [1,2,4,8,...] × 35 mJy beam-1. The synthesized beam is shown in the bottom left corner. The triangle indicates the position of the main peak in the projected galaxy distribution derived by Ramella et al. (2007).
Current usage metrics show cumulative count of Article Views (full-text article views including HTML views, PDF and ePub downloads, according to the available data) and Abstracts Views on Vision4Press platform.
Data correspond to usage on the plateform after 2015. The current usage metrics is available 48-96 hours after online publication and is updated daily on week days.
Initial download of the metrics may take a while.