Fig. 2
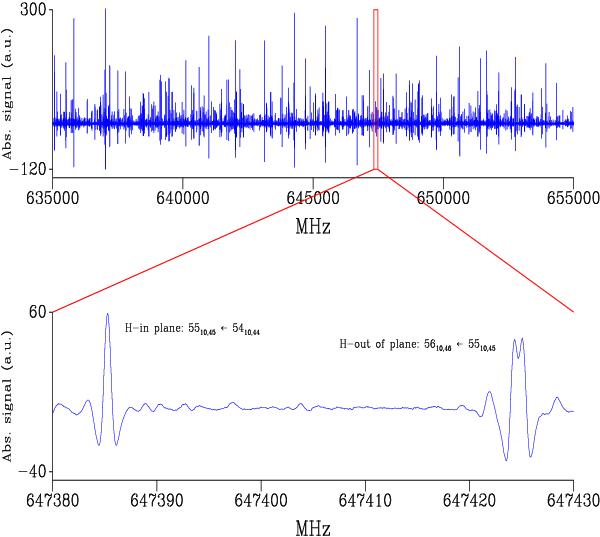
Two portions of the submillimeter-wave spectrum recorded with the Set C experimental setup are shown. Both traces are the second derivative of the actual spectrum profile due to signal demodulation at 2F. The x-axis is the frequency in MHz, the y-axis is the absorption signal in arbitrary units. The upper part of the figure shows the portion from 635 to 655 GHz where R-type lines can be seen that are likely candidates for an astrophysical detection. The lower part shows the smaller portion of the spectrum from 647 380 to 647 430 MHz where two transitions are labeled. The tunneling splitting can be seen for the transition corresponding to the H-out-of-plane configurations.
Current usage metrics show cumulative count of Article Views (full-text article views including HTML views, PDF and ePub downloads, according to the available data) and Abstracts Views on Vision4Press platform.
Data correspond to usage on the plateform after 2015. The current usage metrics is available 48-96 hours after online publication and is updated daily on week days.
Initial download of the metrics may take a while.