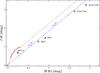
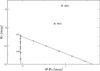
Fig. 8
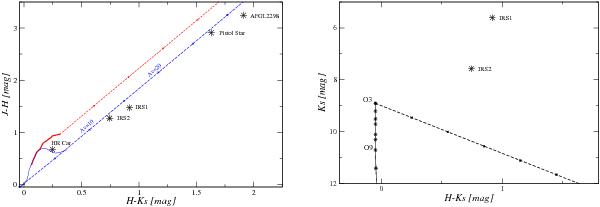
Left: color–color diagram showing the position of IRS1 and IRS2. For comparison we include some confirmed LBV stars. The two solid curves represent the location of the main sequence (thin line) and the giant stars (thicker line) derived from Bessell & Brett (1988). The parallel dashed lines are reddening vectors with the crosses placed at intervals corresponding to five magnitudes of visual extinction. We assumed the interstellar reddening law of Rieke & Lebofsky (1985). Right: color–magnitude diagram of IRS1 and IRS2 The solid curve represents the position of the main sequence at a distance of 4.8 kpc. The reddening vector for an O3-type star, with the squares placed at intervals corresponding to five magnitudes of visual extinction, is shown with a dashed line.
Current usage metrics show cumulative count of Article Views (full-text article views including HTML views, PDF and ePub downloads, according to the available data) and Abstracts Views on Vision4Press platform.
Data correspond to usage on the plateform after 2015. The current usage metrics is available 48-96 hours after online publication and is updated daily on week days.
Initial download of the metrics may take a while.