Fig. 6
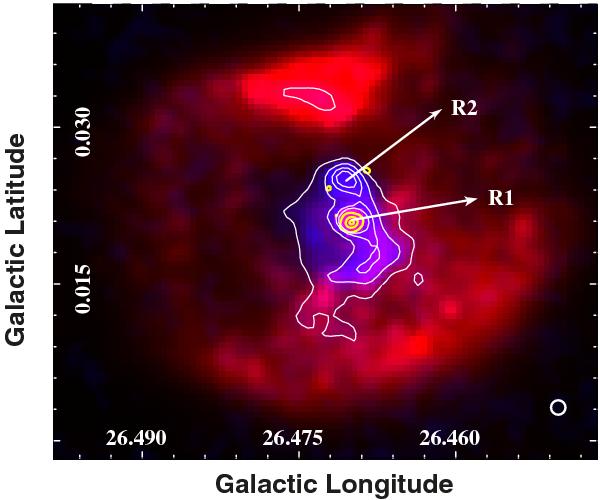
Two-color composite image where the Spitzer-MIPSGAL emission at 24 μm is displayed in red and in blue appears the radio continuum emission at 20 cm with white contours with levels of 2.1, 4.1, 6.7, and 9.0 mJy beam-1. The yellow contours show qualitatively the X-ray emission obtained from Chandra observations (ObsID = 7493; see Sect. 3.4). The beam of the radio continuum emission appears in the bottom right corner.
Current usage metrics show cumulative count of Article Views (full-text article views including HTML views, PDF and ePub downloads, according to the available data) and Abstracts Views on Vision4Press platform.
Data correspond to usage on the plateform after 2015. The current usage metrics is available 48-96 hours after online publication and is updated daily on week days.
Initial download of the metrics may take a while.