Fig. 6
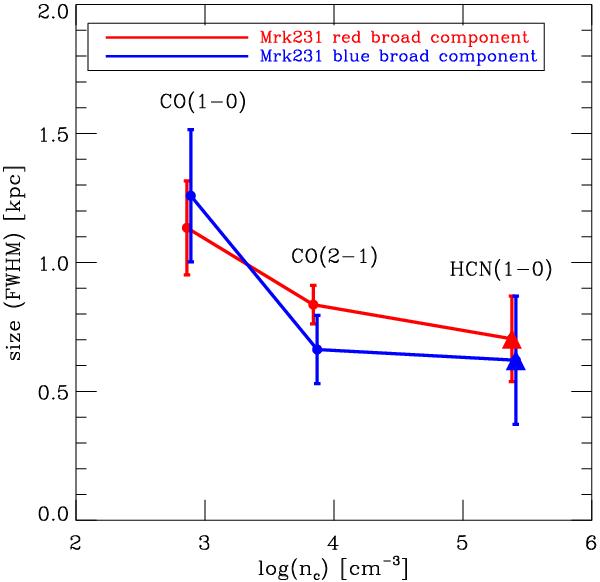
Size (FWHM) of the outflow plotted as a function of the critical density of the corresponding molecular transition used as a wind tracer. Our CO(1 − 0) and CO(2 − 1) IRAM PdBI data are represented by filled circles, while the HCN(1 − 0) observations by Aalto et al. (2012) are denoted by filled triangles. Critical densities were calculated for a molecular medium at T = 100 K. Note that the same conversion factor of 0.828 kpc arcsec-1 has been applied to all data in order to allow comparisons.
Current usage metrics show cumulative count of Article Views (full-text article views including HTML views, PDF and ePub downloads, according to the available data) and Abstracts Views on Vision4Press platform.
Data correspond to usage on the plateform after 2015. The current usage metrics is available 48-96 hours after online publication and is updated daily on week days.
Initial download of the metrics may take a while.