Fig. 3
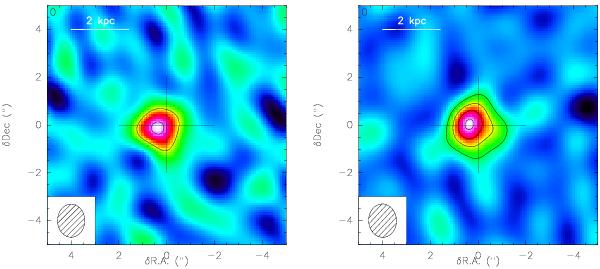
IRAM PdBI maps of the CO(2 − 1) blue (left panel) and red (right panel) broad wings. The size of the map is 10 × 10 arcsec. Contours correspond to 3σ (1σ = 0.6 mJy beam-1). The synthesized beam size is shown at the bottom of the maps. The cross indicates the peak of the radio (VLBI) emission. A tapering with uv taper =50 m has been applied to both the maps; the tapering cuts the visibilities with uv radius <50 m, so the maps appear more detailed and the synthesized beam is slightly smaller than in the original maps. Note that the peaks of the wing maps appear to be slightly offset from the peak of the radio VLBI but are well within the beam.
Current usage metrics show cumulative count of Article Views (full-text article views including HTML views, PDF and ePub downloads, according to the available data) and Abstracts Views on Vision4Press platform.
Data correspond to usage on the plateform after 2015. The current usage metrics is available 48-96 hours after online publication and is updated daily on week days.
Initial download of the metrics may take a while.