Fig. 1
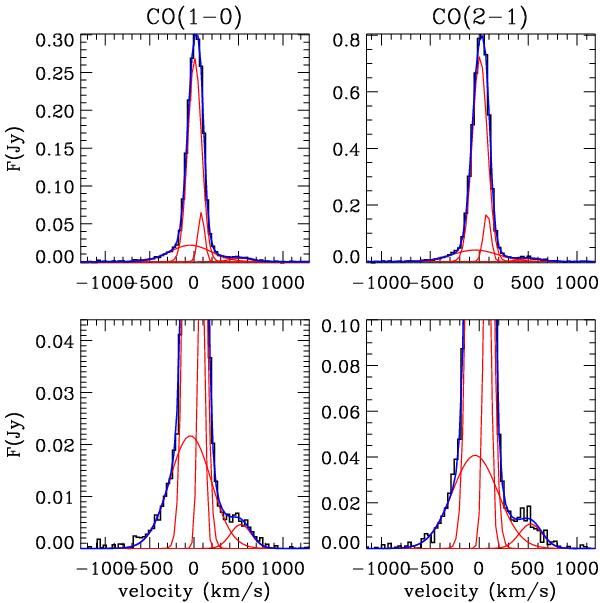
Continuum-subtracted IRAM PdBI spectra of the CO(1 − 0) and CO(2 − 1) emission lines. These spectra are extracted from circular apertures with diameters of 6 arcsec. Top panels: full flux scale. Bottom panels: expanded flux scale to highlight the broad components. The two emission lines were simultaneously fitted with four Gaussian functions (red profiles, see text) tied to have the same centers and widths for the two transitions, to reproduce the three main components of each line (i.e. core, blue, and red broad components). The blue contours represent the results of the fit.
Current usage metrics show cumulative count of Article Views (full-text article views including HTML views, PDF and ePub downloads, according to the available data) and Abstracts Views on Vision4Press platform.
Data correspond to usage on the plateform after 2015. The current usage metrics is available 48-96 hours after online publication and is updated daily on week days.
Initial download of the metrics may take a while.