Fig. 3
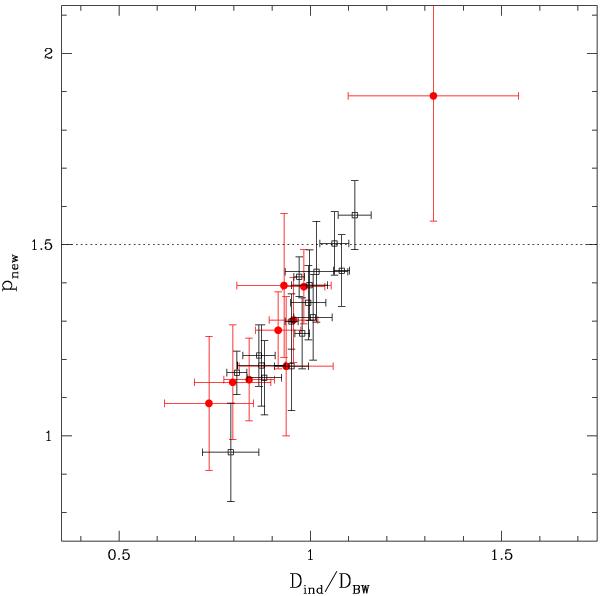
Correlation of distance ratios and calibrated p-factors for Cepheids in the sample. The dashed line indicates the expected limit of p-factor (p = 1.5, see text for more details). The slope of the data at the point where the intercept passes through the origin, is 1.374, which is almost identical to − 0.186 × ⟨ log (P)⟩ + 1.550 = 1.372, with a mean period of ⟨log (P)⟩ = 0.955. Symbols are the same as in Fig. 1. The outlier with largest error bars is FF Aql. (See online edition for a color version.)
Current usage metrics show cumulative count of Article Views (full-text article views including HTML views, PDF and ePub downloads, according to the available data) and Abstracts Views on Vision4Press platform.
Data correspond to usage on the plateform after 2015. The current usage metrics is available 48-96 hours after online publication and is updated daily on week days.
Initial download of the metrics may take a while.