Fig. 6
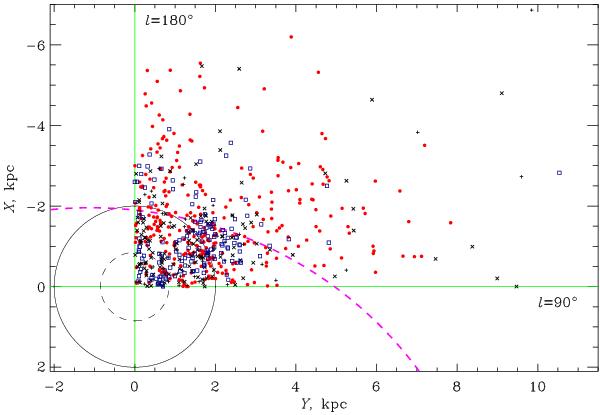
Distribution of star clusters in the XY-plane centred at the position of the Sun. Blue squares mark the youngest (log t ≤ 7.9) clusters, black plusses show clusters with 7.9 < log t ≤ 8.3, black crosses correspond to clusters with 8.3 < log t ≤ 8.75, while red circles represent old clusters with log t > 8.75. The dashed magenta thick curve is the Perseus spiral arm fitted by a two-arm model of the spiral pattern with a pitch-angle of − 6°. The large black dashed circle around the Sun indicates the completeness area of the COCD sample. The black solid circle marks the estimated probable completeness area of MWSC.
Current usage metrics show cumulative count of Article Views (full-text article views including HTML views, PDF and ePub downloads, according to the available data) and Abstracts Views on Vision4Press platform.
Data correspond to usage on the plateform after 2015. The current usage metrics is available 48-96 hours after online publication and is updated daily on week days.
Initial download of the metrics may take a while.