Fig. 2
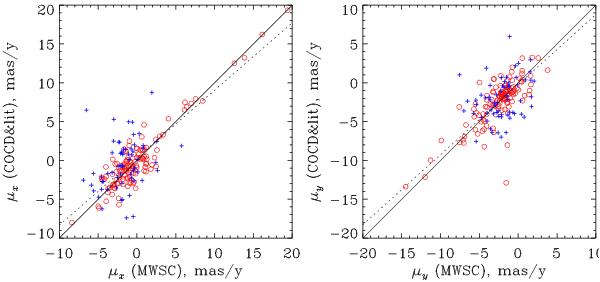
Comparison of the average cluster proper motions (left panel for X-component, right panel for Y), derived in the present study with corresponding data from the literature. COCD clusters are shown by red circles, other clusters are shown by blue plusses. The straight line is a bisector, the dotted line is the linear fit of the data.
Current usage metrics show cumulative count of Article Views (full-text article views including HTML views, PDF and ePub downloads, according to the available data) and Abstracts Views on Vision4Press platform.
Data correspond to usage on the plateform after 2015. The current usage metrics is available 48-96 hours after online publication and is updated daily on week days.
Initial download of the metrics may take a while.