Free Access
Fig. 1
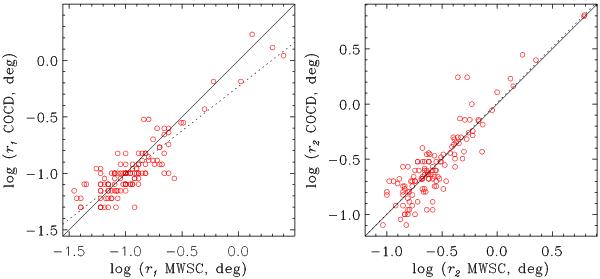
Comparison of apparent radii of open clusters (left panel for r1, right panel for r2) derived with corresponding data from the COCD. The straight line is a bisector, the dotted line is the linear fit of the data.
Current usage metrics show cumulative count of Article Views (full-text article views including HTML views, PDF and ePub downloads, according to the available data) and Abstracts Views on Vision4Press platform.
Data correspond to usage on the plateform after 2015. The current usage metrics is available 48-96 hours after online publication and is updated daily on week days.
Initial download of the metrics may take a while.