Free Access
Fig. A.1
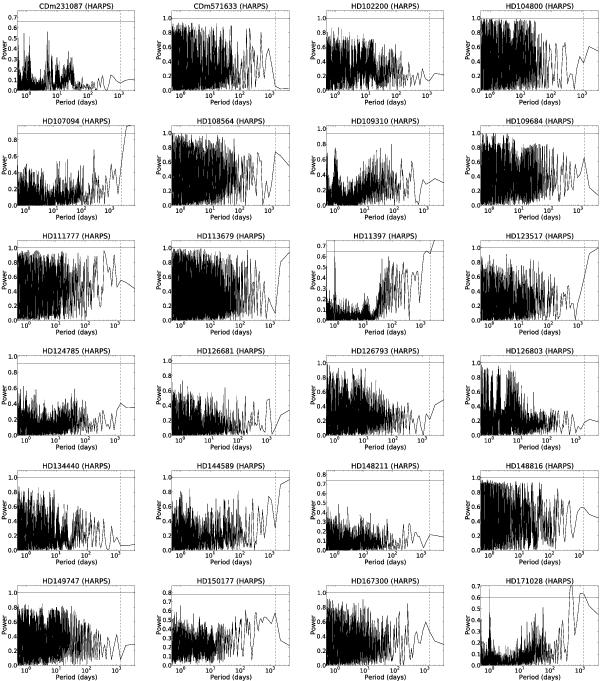
Figures of the GLS periodograms for stars with at least six measurements. The horizontal black line notes the power of the 0.1% FAP and the vertical dotted line, the timespan of the measurements.
Current usage metrics show cumulative count of Article Views (full-text article views including HTML views, PDF and ePub downloads, according to the available data) and Abstracts Views on Vision4Press platform.
Data correspond to usage on the plateform after 2015. The current usage metrics is available 48-96 hours after online publication and is updated daily on week days.
Initial download of the metrics may take a while.