Free Access
Fig. 4
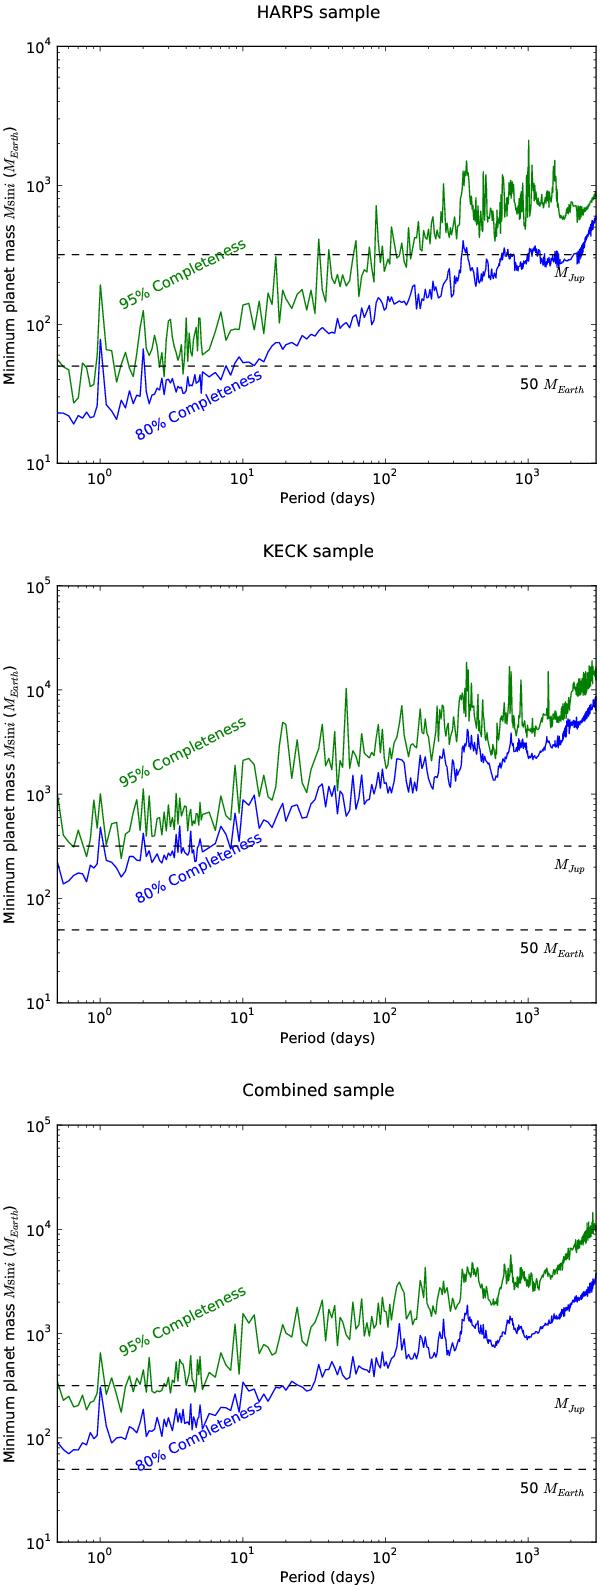
Planetary mass is plotted against period. The blue line shows the detection limits for circular planetary signals in the data with a FAP of 1%. In the top panel, the data from the HARPS sample are shown. In the middle panel the data from the KECK-HIRES sample are shown and in the bottom panel, the combined sample is shown.
This figure is made of several images, please see below:
Current usage metrics show cumulative count of Article Views (full-text article views including HTML views, PDF and ePub downloads, according to the available data) and Abstracts Views on Vision4Press platform.
Data correspond to usage on the plateform after 2015. The current usage metrics is available 48-96 hours after online publication and is updated daily on week days.
Initial download of the metrics may take a while.