Free Access
Fig. 3
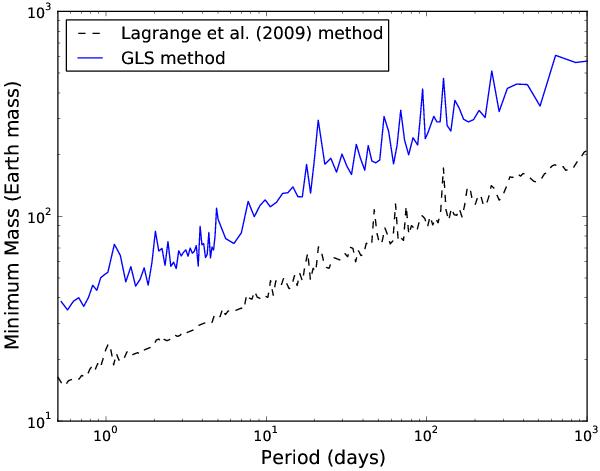
Planetary mass is plotted against period for G19-27 (Keck sample). The blue (upper solid) line shows the detection limits for circular planetary signals in the data with a FAP of 1%. The black (lower dashed) line shows the detection limits based on the method described in Lagrange et al. (2009).
Current usage metrics show cumulative count of Article Views (full-text article views including HTML views, PDF and ePub downloads, according to the available data) and Abstracts Views on Vision4Press platform.
Data correspond to usage on the plateform after 2015. The current usage metrics is available 48-96 hours after online publication and is updated daily on week days.
Initial download of the metrics may take a while.