Fig. 2
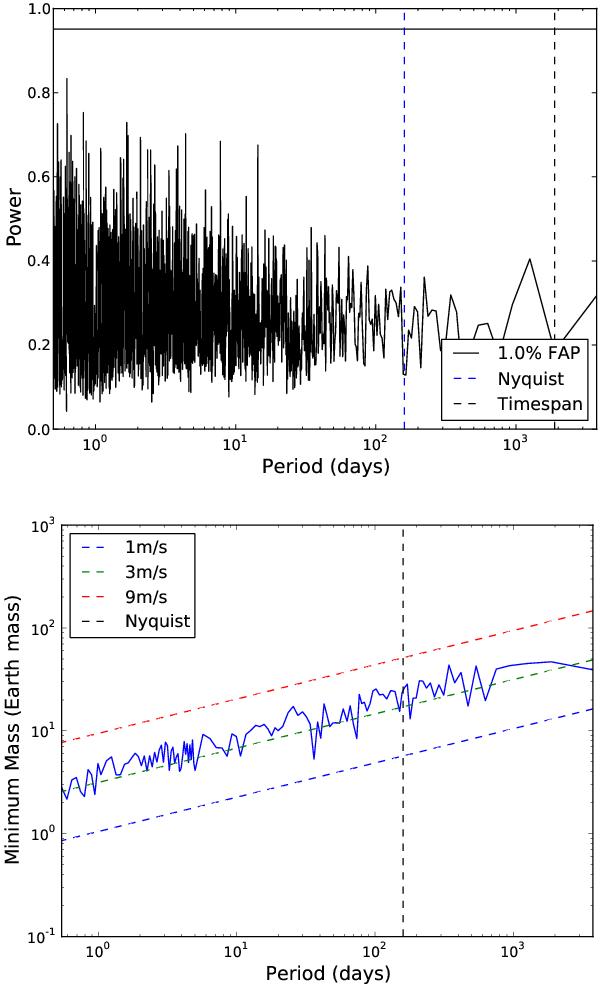
Example of the GLS periodogram (top panel) and the detection limits (bottom panel) for the star HD 134440 with measurements from HARPS and KECK-HIRES. For both plots, a Keplerian fit was made. In the top panel, the power is plotted against the period. The horizontal solid line marks the power level for an FAP of 1%. The bottom panel plots the minimum planetary mass against the period. The solid line represents the detection limits for these data. The dashed lines indicate a circular planetary signal with an RV semi-amplitude of 1, 3 and 9 m s-1 (lower to higher line).
Current usage metrics show cumulative count of Article Views (full-text article views including HTML views, PDF and ePub downloads, according to the available data) and Abstracts Views on Vision4Press platform.
Data correspond to usage on the plateform after 2015. The current usage metrics is available 48-96 hours after online publication and is updated daily on week days.
Initial download of the metrics may take a while.