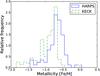
Fig. 1
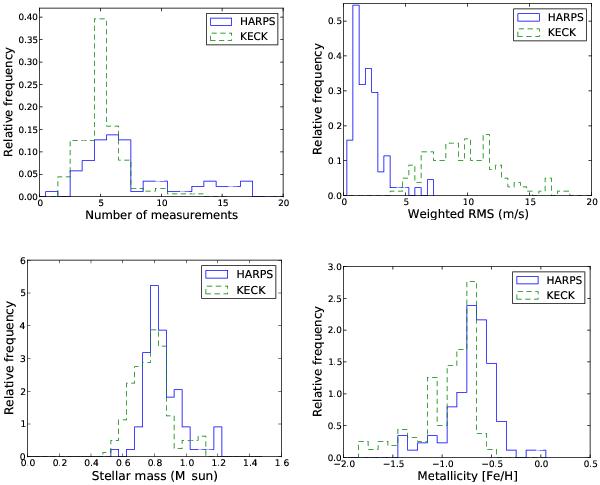
Relative histogram of the number of measurements (top left panel), rms noise (top right panel), stellar mass (bottom left panel) and metallicity (bottom right panel) in the two datasets. The blue line represents the HARPS sample, the green line the KECK-HIRES sample. Both graphs in the top panel are cut at 20 for better visibility. The top left panel has 19 stars from the HARPS sample higher then 20. The top right panel has 1 star from the KECK sample higher then 20.
Current usage metrics show cumulative count of Article Views (full-text article views including HTML views, PDF and ePub downloads, according to the available data) and Abstracts Views on Vision4Press platform.
Data correspond to usage on the plateform after 2015. The current usage metrics is available 48-96 hours after online publication and is updated daily on week days.
Initial download of the metrics may take a while.