Fig. 3
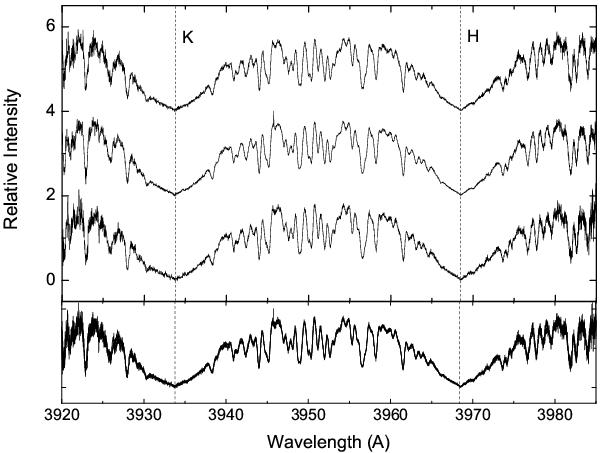
The spectral line of the Ca II H & K region in α Per. It displays three spectra exhibiting positive, zero, and negative RV deviations, respectively (top panel), and a combined figure of the three features (bottom panel). No emission features are seen around the Ca II H & K central region, and any systematic differences in line profiles are invisible.
Current usage metrics show cumulative count of Article Views (full-text article views including HTML views, PDF and ePub downloads, according to the available data) and Abstracts Views on Vision4Press platform.
Data correspond to usage on the plateform after 2015. The current usage metrics is available 48-96 hours after online publication and is updated daily on week days.
Initial download of the metrics may take a while.