Fig. 9
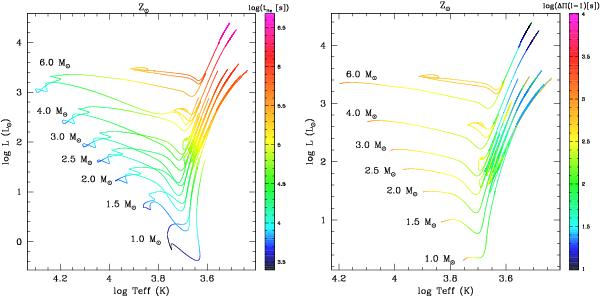
Color-coded HR diagram for all the masses in the grid at solar metallicity. The color code represents the values (in seconds) of the acoustic radius at the base of the ionization of He II tHe (left panel) and of the asymptotic period spacing of g-modes ΔΠ(ℓ = 1) (right panel). The values increase from blue to red in both cases as shown on the scales on the right of the plots.
Current usage metrics show cumulative count of Article Views (full-text article views including HTML views, PDF and ePub downloads, according to the available data) and Abstracts Views on Vision4Press platform.
Data correspond to usage on the plateform after 2015. The current usage metrics is available 48-96 hours after online publication and is updated daily on week days.
Initial download of the metrics may take a while.