Fig. 6
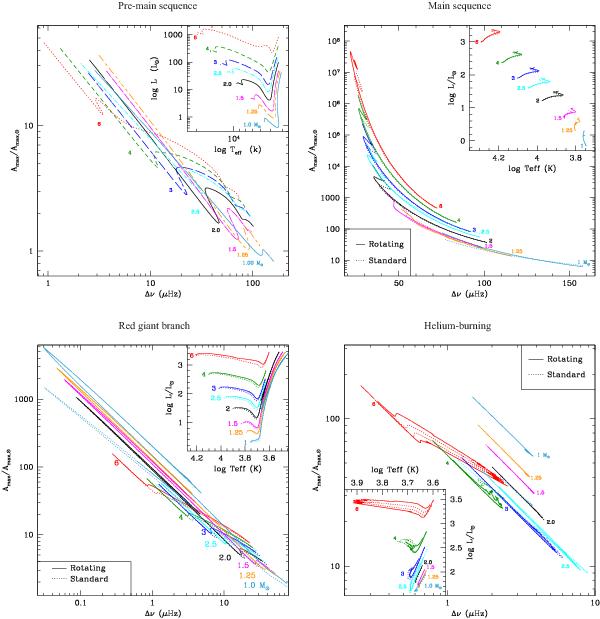
Maximal amplitude compared to solar as a function of the larger separation for models at Z⊙. Top-left panel: on the pre-main sequence; top-right panel: on the main sequence; bottom-left panel: on the red giant branch; bottom-right panel: on helium-burning phase. Standard models and rotating models are shown with dashed and solid lines respectively except for pre-main sequence. The corresponding evolution in the Hertzsprung-Russell diagram is shown on the right corner of each panel.
Current usage metrics show cumulative count of Article Views (full-text article views including HTML views, PDF and ePub downloads, according to the available data) and Abstracts Views on Vision4Press platform.
Data correspond to usage on the plateform after 2015. The current usage metrics is available 48-96 hours after online publication and is updated daily on week days.
Initial download of the metrics may take a while.