Fig. 5
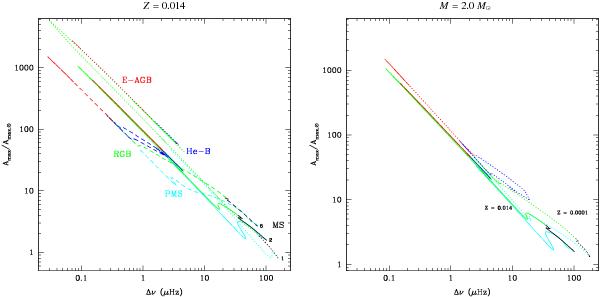
Maximal amplitude compared to solar as a function of the large separation: (left panel) at solar metallicity for 1.25 M⊙, 2.0 M⊙, and 6.0 M⊙ rotating models, and (right panel ) at two metallicities Z = 0.014 (solid lines) and Z = 0.0001 (dotted-lines) for a 2.0 M⊙ rotating model. Evolutionary phases are color-labeled: pre-main sequence (cyan), main sequence (black), RGB (green), helium-burning (blue), and AGB (red).
Current usage metrics show cumulative count of Article Views (full-text article views including HTML views, PDF and ePub downloads, according to the available data) and Abstracts Views on Vision4Press platform.
Data correspond to usage on the plateform after 2015. The current usage metrics is available 48-96 hours after online publication and is updated daily on week days.
Initial download of the metrics may take a while.