Fig. 2
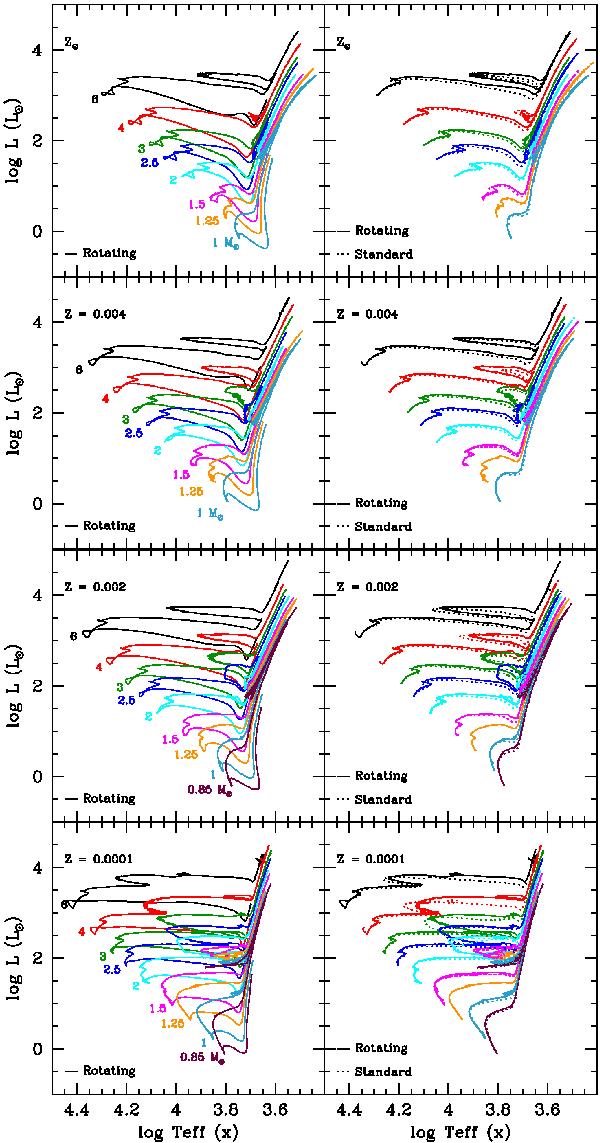
Theoretical evolution tracks in the HR diagram for the ensemble of calculated models for all metallicities (Z⊙, Z = 0.004, Z = 0.002, and Z = 0.0001, from top to bottom). In the left panels, the tracks are shown for the rotating models from the pre-main sequence on. In the right panels, both standard and rotating predictions are shown (dashed and solid lines respectively) from the ZAMS and beyond.
Current usage metrics show cumulative count of Article Views (full-text article views including HTML views, PDF and ePub downloads, according to the available data) and Abstracts Views on Vision4Press platform.
Data correspond to usage on the plateform after 2015. The current usage metrics is available 48-96 hours after online publication and is updated daily on week days.
Initial download of the metrics may take a while.