Fig. 3
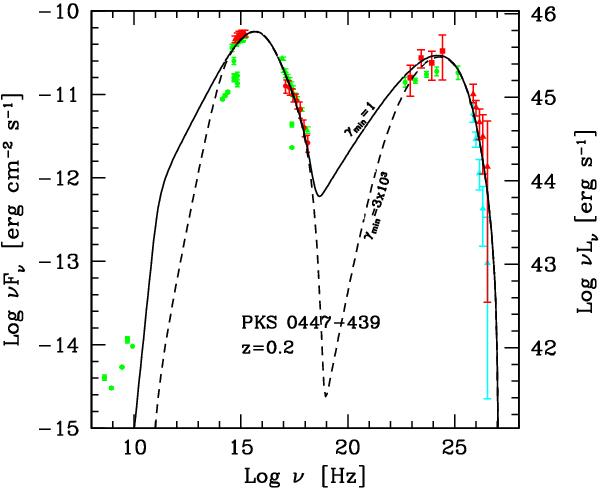
SED of PKS 0447 − 439 during the epoch of HESS observation (November 2009 − January 2010). Red points represent Swift/UVOT, Swift/XRT, Fermi/LAT and de-absorbed (assuming z = 0.2) HESS data. Cyan data are the observed HESS data. Green symbols report historical data obtained through the ASI/ASDC tools. Green LAT points are from the 1LAC catalogue. The black lines are the result of the one-zone emission leptonic model discussed in the text for two different values of the minimum Lorentz factor of the emitting electrons, γmin = 1 (solid) and γmin = 3 × 10³ (dashed). See text for details.
Current usage metrics show cumulative count of Article Views (full-text article views including HTML views, PDF and ePub downloads, according to the available data) and Abstracts Views on Vision4Press platform.
Data correspond to usage on the plateform after 2015. The current usage metrics is available 48-96 hours after online publication and is updated daily on week days.
Initial download of the metrics may take a while.