Free Access
Fig. 8
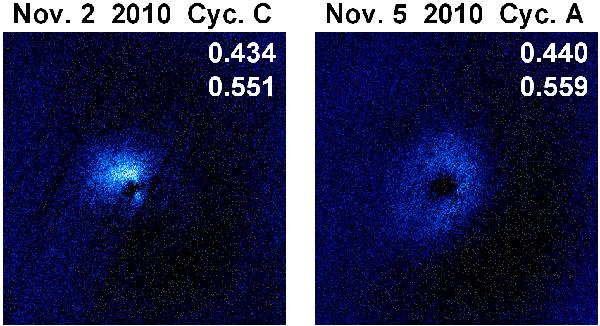
Evolution of the central CN shell observed on November 2 (Cycle C) and November 5 (Cycle A). The behaviour in time is displayed by the result of the subtraction of the earlier exposure from the later one. Precession phases are shown in the upper right corners. Orientation and image scale are the same as in Fig. 1.
Current usage metrics show cumulative count of Article Views (full-text article views including HTML views, PDF and ePub downloads, according to the available data) and Abstracts Views on Vision4Press platform.
Data correspond to usage on the plateform after 2015. The current usage metrics is available 48-96 hours after online publication and is updated daily on week days.
Initial download of the metrics may take a while.