Fig. 7
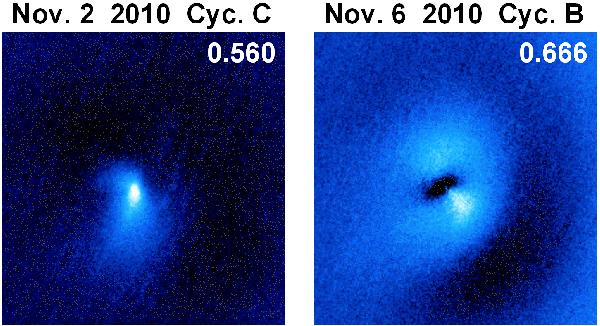
Comparison of the transient structures in the CN coma on November 2 (Cycle C) and November 6 (Cycle B). Each panel presents the result of the subtraction of the reference residual image (November 5) from the actual residual frame. Phases are displayed in the upper-right corners. Orientation and image scale are identical as in Fig. 1.
Current usage metrics show cumulative count of Article Views (full-text article views including HTML views, PDF and ePub downloads, according to the available data) and Abstracts Views on Vision4Press platform.
Data correspond to usage on the plateform after 2015. The current usage metrics is available 48-96 hours after online publication and is updated daily on week days.
Initial download of the metrics may take a while.