Fig. 10
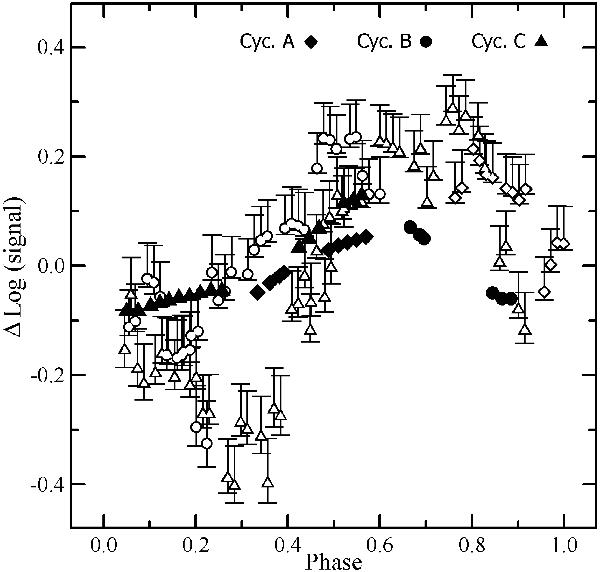
Comparison between the molecular light curves of CN (see text) and HCN (from Drahus et al. 2011). The HCN signal is represented by the line area measured in the beam of 8.8-arcsec FWHM. The light curves are calculated with respect to the mean levels, and phased according to the 18.32 h period. The filled symbols are used for CN and the open symbols for HCN, while the symbol shape indicates the three-cycle component. The error bars for CN are of the order of the symbol size and have been omitted.
Current usage metrics show cumulative count of Article Views (full-text article views including HTML views, PDF and ePub downloads, according to the available data) and Abstracts Views on Vision4Press platform.
Data correspond to usage on the plateform after 2015. The current usage metrics is available 48-96 hours after online publication and is updated daily on week days.
Initial download of the metrics may take a while.