Fig. 2
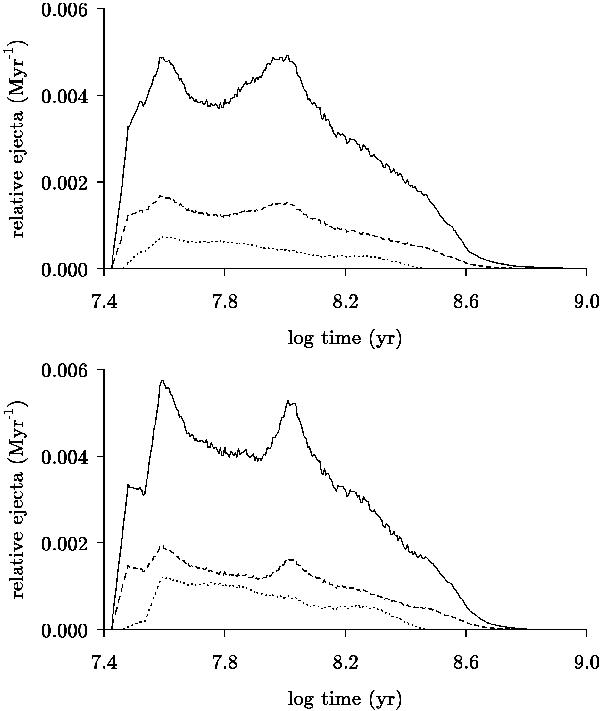
Ejecta per Myr of a population of 100% IMCBs as a function of time since starburst, normalized to the total mass ejected. Displayed are total ejecta (solid), ejected He (dashed) and ejected TPAGB-enriched material (dotted). Both figures describe a model with a flat q-distribution, β = 1, η = 2.3. The top (respectively bottom) figure is calculated with αλ = 1 (respectively 0.1).
Current usage metrics show cumulative count of Article Views (full-text article views including HTML views, PDF and ePub downloads, according to the available data) and Abstracts Views on Vision4Press platform.
Data correspond to usage on the plateform after 2015. The current usage metrics is available 48-96 hours after online publication and is updated daily on week days.
Initial download of the metrics may take a while.