Fig. 3
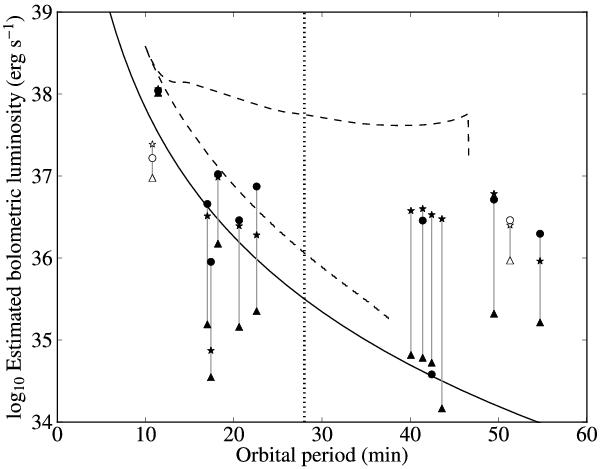
UCXB time-averaged bolometric luminosity against orbital period. The solid curve represents the modeled evolution of an UCXB with a zero-temperature helium white dwarf donor (Eq. (7)). The dashed curve represents the modeled evolution of an initially detached system with an 0.65 M⊙ helium burning donor starting at an orbital period of 100 min, which starts mass transfer via Roche-lobe overflow at an orbital period of 46 min (Yungelson 2008). Both systems have an 1.4 M⊙ neutron star accretor. The triangles represent the absolute lower bounds on the luminosity based on only the highly significant ASM dwells and assuming zero luminosity at all other times (Sects. 2.3.1 and 3.1, Fig. 2). The stars above these represent the power-law extrapolation of the bright-end part of the cumulative luminosity distribution  (Sect. 3.1.1). The circles represent the time-averaged bolometric luminosities based on all dwells
  . Filled symbols correspond to confirmed UCXBs, open symbols correspond to UCXB candidates with a tentative orbital period. Symbols at the same orbital period correspond to the same source and are connected by a gray line for clarity. For two sources the average count rate is negative so the circle is not shown. The vertical dotted line at 28 min represents the orbital period above which a helium accretion disk becomes subject to the thermal-viscous instability, based on the zero-temperature white dwarf donor model by van Haaften et al. (2012b).
Current usage metrics show cumulative count of Article Views (full-text article views including HTML views, PDF and ePub downloads, according to the available data) and Abstracts Views on Vision4Press platform.
Data correspond to usage on the plateform after 2015. The current usage metrics is available 48-96 hours after online publication and is updated daily on week days.
Initial download of the metrics may take a while.