Free Access
Fig. 3
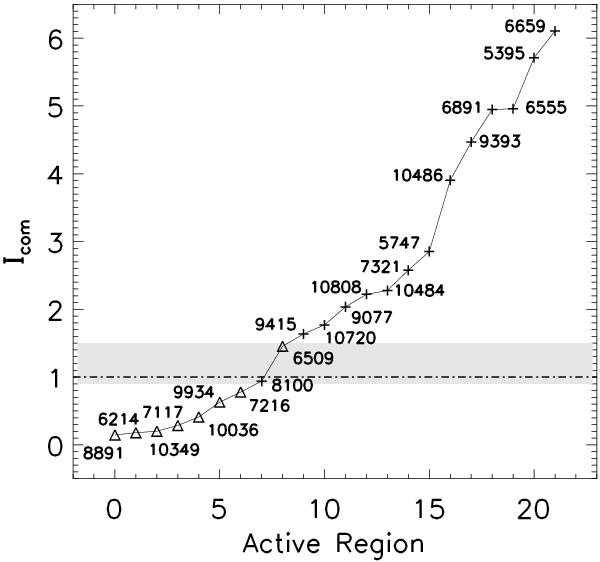
Distribution of the composite index Icom of the SARs and FARs. Each plus and triangle represents an SAR and an FAR, respectively. The dash-dotted line represents the cut-off value distinguishing the SARs and FARs, and the number represents the NOAA number of each AR. In the gray area, SAR and FAR cannot be distinguished.
Current usage metrics show cumulative count of Article Views (full-text article views including HTML views, PDF and ePub downloads, according to the available data) and Abstracts Views on Vision4Press platform.
Data correspond to usage on the plateform after 2015. The current usage metrics is available 48-96 hours after online publication and is updated daily on week days.
Initial download of the metrics may take a while.