Fig. 2
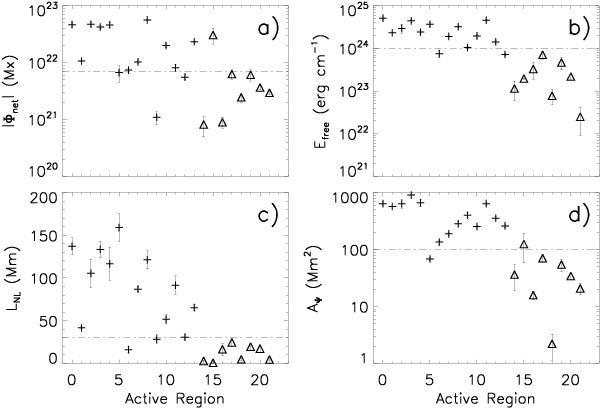
Distribution of a) the magnetic flux imbalance between opposite polarities | Φnet | ; b) the total photospheric free magnetic energy Efree; c) the length of the magnetic neutral line with a steep horizontal magnetic gradient LNL; and d) the area with strong magnetic shear AΨ of the SARs and FARs. Each plus and triangle represents the value of an SAR and an FAR with error bars, respectively. The dash-dotted lines represent the cut-off value of each parameter.
Current usage metrics show cumulative count of Article Views (full-text article views including HTML views, PDF and ePub downloads, according to the available data) and Abstracts Views on Vision4Press platform.
Data correspond to usage on the plateform after 2015. The current usage metrics is available 48-96 hours after online publication and is updated daily on week days.
Initial download of the metrics may take a while.