Fig. 1
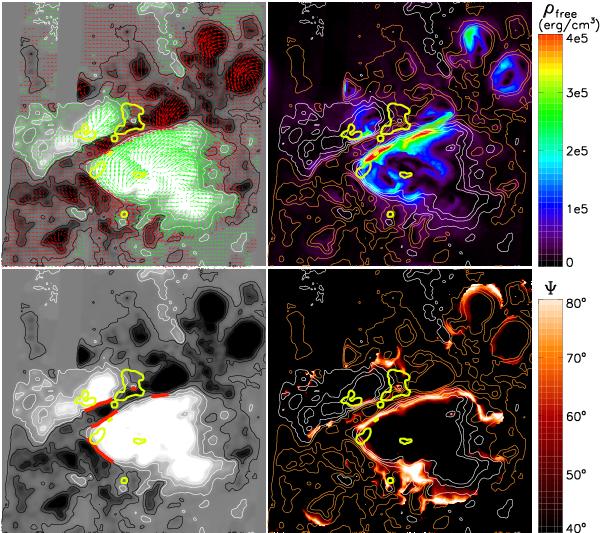
Top left: vector magnetograms of AR 10486, in which the vertical field component is shown by contours with white (black) lines for positive (negative) polarity at 06:07 UT on 28 October 2003. The contour levels are ± 100, ± 500, ± 1000 G, and the transverse fields are shown by arrows whose length is proportional to the field strength. Green (red) arrows for fields indicate positive (negative) polarity. The yellow contours are the X17.2 flare observed by the Transition Region and Coronal Explorer at 10:05 UT on 28 October 2003. Top right: the photospheric free magnetic energy density distribution with contours of the vertical field component and flare. The white (orange) contours represent the positive (negative) polarity. Bottom left: the magnetic neutral line with the steep horizontal magnetic gradient ( ≥ 300 G Mm-1, red lines) with contours of the vertical field component and flare. Bottom right: the magnetic shear angle distribution with contours of the vertical field component and flare. Angles larger than 80° and smaller than 40° are plotted in white and black, respectively. The size and the position of the center of the field of view in each panel is 245″ × 245″ and S216″E351″, respectively.
Current usage metrics show cumulative count of Article Views (full-text article views including HTML views, PDF and ePub downloads, according to the available data) and Abstracts Views on Vision4Press platform.
Data correspond to usage on the plateform after 2015. The current usage metrics is available 48-96 hours after online publication and is updated daily on week days.
Initial download of the metrics may take a while.