Fig. 5
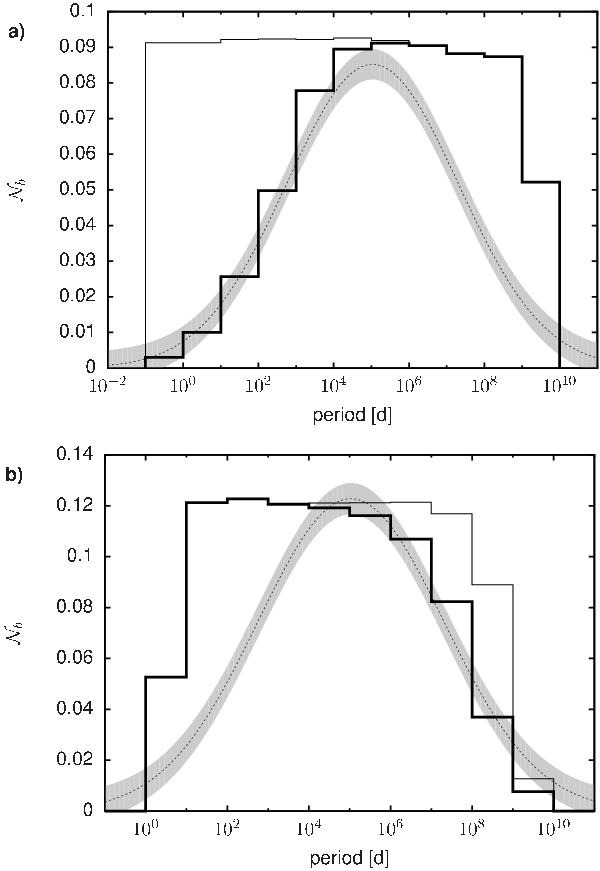
a) Chosen initial period distribution (thin solid line) and effect of the gas-induced orbital decay on period distributions of binaries embedded in an r-2 gas density distribution with ρmax = 105 cm-3 and a sound speed of 0.49 km s-1 after 1 Myr (thick solid line), compared with a Gaussian fit (dotted line) to the observations by Raghavan et al. (2010). b) Same as in a), with results from the nbody6 simulations.


Current usage metrics show cumulative count of Article Views (full-text article views including HTML views, PDF and ePub downloads, according to the available data) and Abstracts Views on Vision4Press platform.
Data correspond to usage on the plateform after 2015. The current usage metrics is available 48-96 hours after online publication and is updated daily on week days.
Initial download of the metrics may take a while.